Hey Riders!
Climate change is threatening our environment.
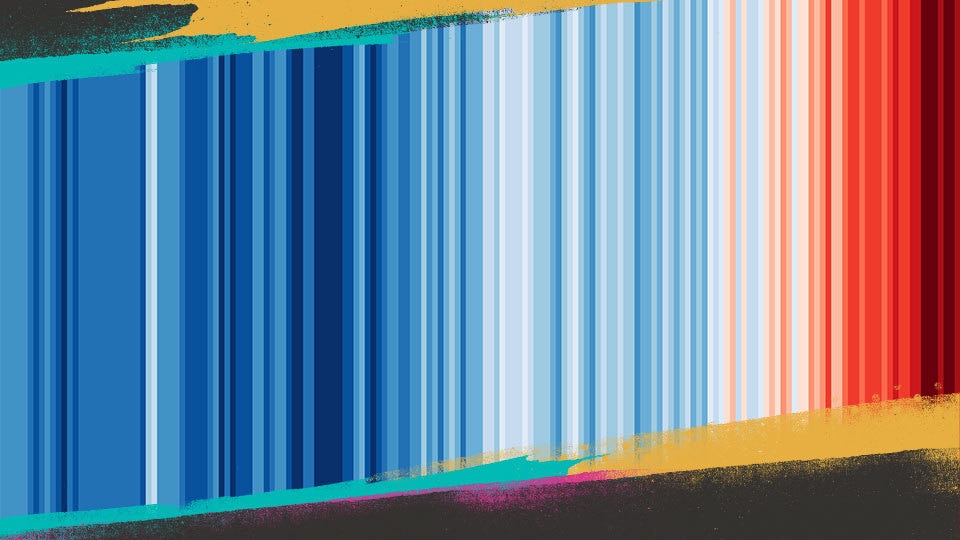
The Riders Republic team is made up of outdoor enthusiasts. Sharing our passion was one of the was one of the pillars behind the creation of the game. So we want to raise awareness about this threat, especially for the natural playgrounds we love, like forests, parks, and mountains. That's why we're featuring this mural near the big screen at The Deck skatepark.
These "warming stripes" graphics are visual representations of the change in temperature measured in each country, region, or city over the past 100+ years.
They were created by Ed Hawkins of the National Centre for Atmospheric Science at the University of Reading.
The stripes in this mural are those of the United States, where Riders Republic's map is set. Each stripe or bar represents the temperature in country averaged over a year. The stripes start around the year 1900 and end in 2022.
You can see that the stripes change from mostly blue to mostly red in more recent years, illustrating the increase in average temperatures in that location.
To learn more about the "warming stripes" and see the data for your country, visit showyourstripes.info.
Graphics and lead scientist: Ed Hawkins, National Centre for Atmospheric Science, University of Reading.
Data source NOAA


